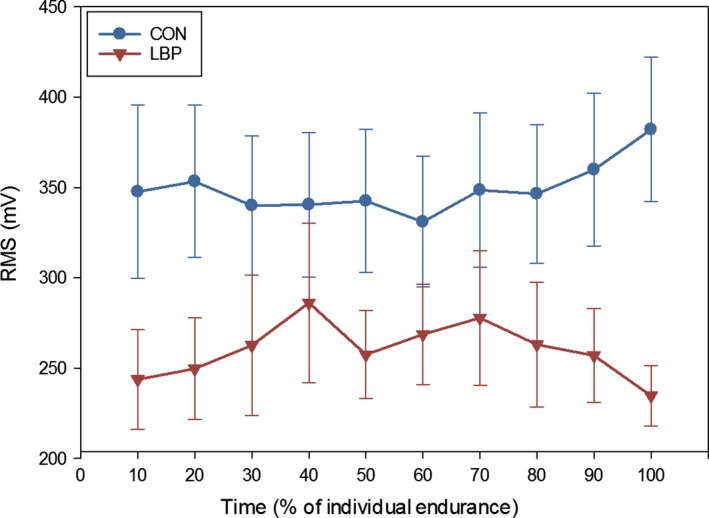
Figure 3.

Average RMS values for LBP and CON participants across the duration of the endurance contractions (and SE), shown in 10% epochs of the participants’ total endurance times. No interactions or differences in shift were found between groups, but the CON group was found to be systematically higher throughout the contraction.
