
Figure 4.
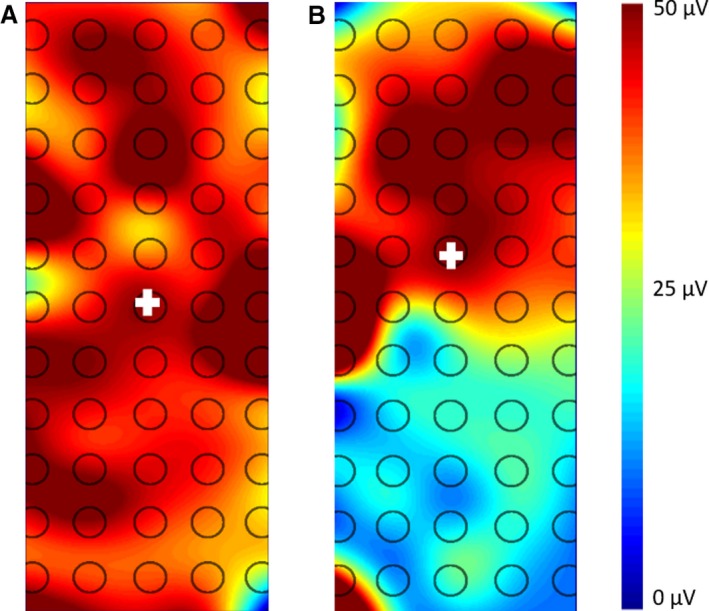
Representative RMS topographical maps for CON (A) and LBP (B) participants during the endurance task. The centroid is depicted by the crosshair and the scale is indicated in μV.
Official websites use .gov
A
.gov website belongs to an official
government organization in the United States.
Secure .gov websites use HTTPS
A lock (
) or https:// means you've safely
connected to the .gov website. Share sensitive
information only on official, secure websites.
Representative RMS topographical maps for CON (A) and LBP (B) participants during the endurance task. The centroid is depicted by the crosshair and the scale is indicated in μV.