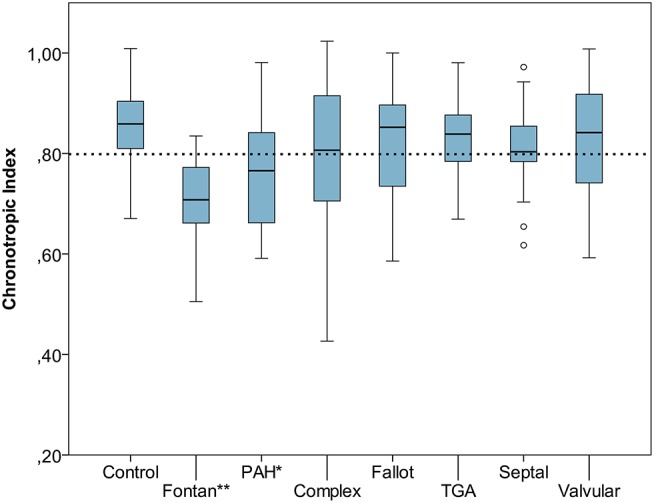
Figure 1.

Chronotropic index [Chronotropic index = (peak heart rate–resting heart rate)/(220–age–resting heart rate)] of control group vs. congenital heart disease (CHD) subgroups. Dashed line marks chronotropic incompetence threshold of 0.8. *p < 0.05, **p < 0.001. Boxplot bottom indicates 25th, top of the box 75th percentile. Whiskers extend to 1.5 times of box height or to minimum/maximum value. Outliers are shown as points.
