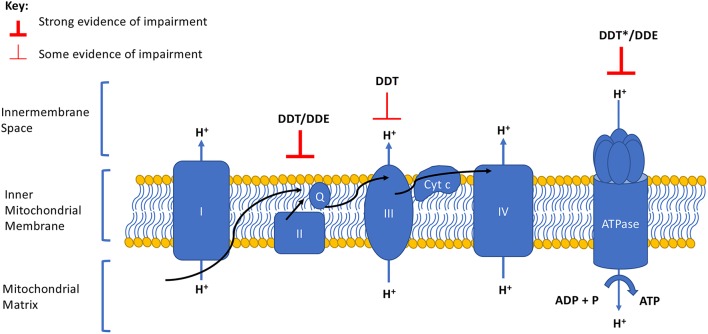
Figure 1.
Summary of DDT and DDE effects on the electron transport chain and oxidative phosphorylation complexes. Degree of evidence is represented by weight of line and corresponds to data presented in Table 1. Arrows indicate the direction of the electron flow. Q, ubiquinone; Cyt c, cytochrome c. *Evidence of a strong effect but opposing directionality exists.

