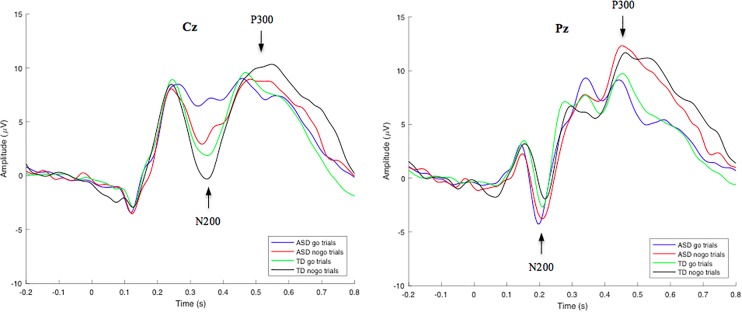
FIGURE 2.
Grand-average go/nogo stimulus-locked waveforms for correct go and nogo trials in TD and ASD groups at electrode site Cz (left) and Pz (right). Mean N200 and P300 component amplitudes were obtained from latency windows of 300–400 ms and 450–600 ms, respectively. N200-go, N200-nogo, and P300-nogo amplitudes were measured at electrode Cz, while P300-go amplitude was measured at electrode Pz.

