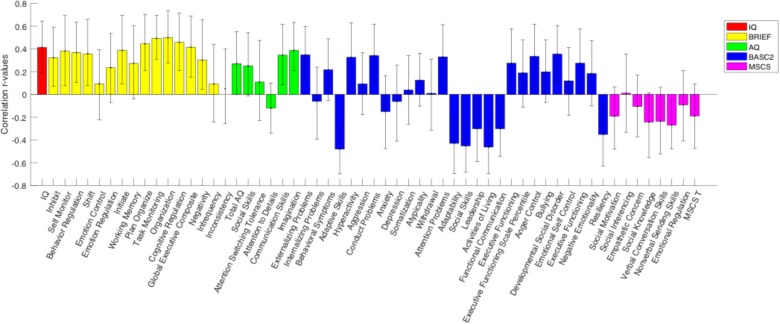
FIGURE 4.
PLS analysis between N200 amplitude and behavioral scores for the TD group. The height of the correlation bars indicates the magnitude of the r-values representing the correlation between behavioral measures and neural data, while the direction of the correlation bars indicates the type of association between behavioral measures and neural data. A positive bar signifies a positive correlation between behavioral measures and neural scores (i.e., as the behavioral score increases, N200 voltage also increases). Error bars reveal an upper and lower error range for the correlation between behavioral measures and neural data based on a series of bootstrapping analyses. An error bar that does not include zero indicates a significant correlation between the behavioral measure and N200 amplitude.

