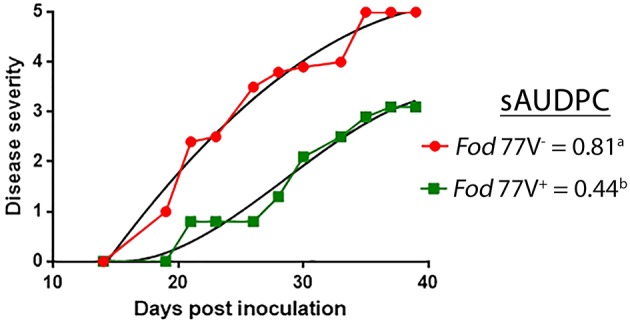
Figure 5.

Representative graph of the progress of the disease severity symptoms. Fusarium wilt symptoms were scored for a period of 40 days, using a scale from 0 (no symptoms) to 5 (dead plant), in carnation plants inoculated with the virus-free (V−) or the virus-infected (V+) strain of F. oxysporum f. sp. dianthi isolate 77. Disease severity values were used to calculate the percentage of the standardized area under the disease progress curve (sAUDPC). Values followed by different letters are significantly different according to Fisher's least significant difference (LSD) test (P ≤ 0.05).
