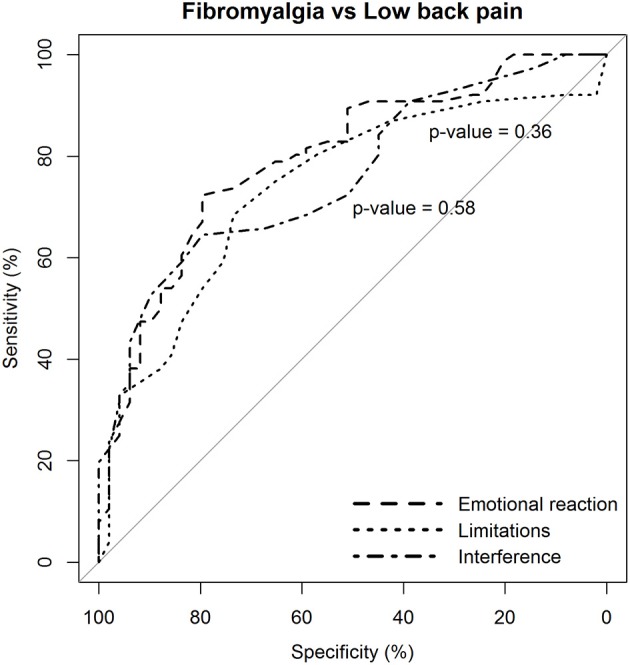
Figure 3.

Statistical comparison of the ROC curves between the predictive capacity of the “emotional reaction to pain” subscale of the BEEP and the other two subscales–“limitations caused by pain in daily life” and “interference with personal and social functioning”–in differentiating patients with fibromyalgia from patients with low back pain. The statistical significance of the difference between the areas under the ROC curves derived from the same cases is based on the method by DeLong et al. (1988).
