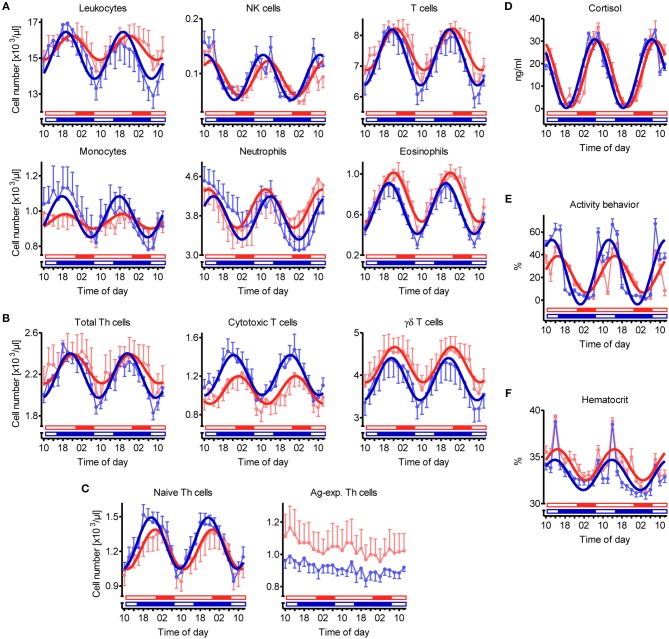
Figure 2.
Diurnal rhythms of the cell numbers of different immune cell populations in blood, plasma cortisol concentration, activity behavior, and hematocrit in domestic pigs. Values for pigs held under long day conditions (LD) are shown in red, values for pigs held under short day conditions (SD) are shown in blue. Open bars indicate light periods, filled bars indicate dark periods for the respective lighting regime. Measured values are shown in pale color per treatment (mean ± SEM, LD n = 9, SD n = 11). Dark curves correspond to the results of overall cosinor analyses with combined datasets of all animals per treatment (LD n = 9, SD n = 11, significant diurnal rhythm at P < 0.05, refer to Table 1). Diurnal rhythms in cell numbers in porcine blood are depicted for (A) main immune cell populations, (B) different T cell subpopulations, and (C) Th cell subtypes with distinctive differentiation states. In addition, diurnal rhythms in (D) plasma cortisol concentration, (E) activity behavior (values represent the proportion of time, in which the animals were active within the 2-h interval preceding blood sampling), and (F) hematocrit are shown.

