Figure 5.
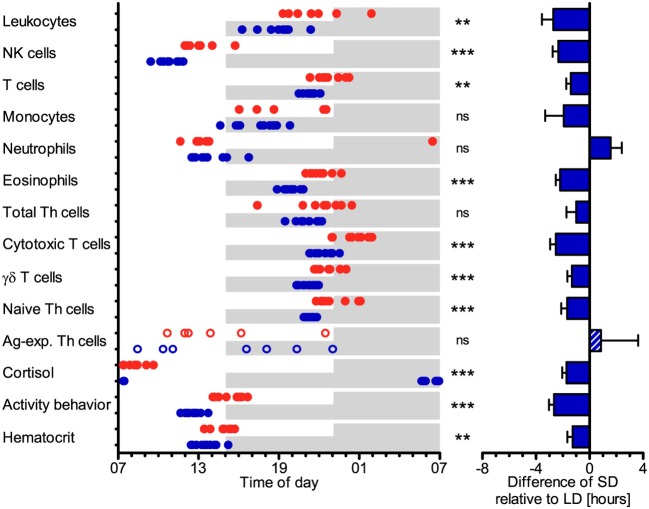
Peak times of the cell numbers of different immune cell populations in blood, plasma cortisol concentration, activity behavior, and hematocrit in domestic pigs. Values for pigs held under long day conditions (LD) are shown in red, values for pigs held under short day conditions (SD) are shown in blue. Shaded areas indicate lights-off in the respective treatments. The graphs and statistical analyses only include values of animals with significant (P < 0.05) diurnal rhythm in individual cosinor analyses in the respective variable (LD n = 5–9, SD n = 7–11, refer to Table S1). The bar graph on the right side illustrates the differences in peak times of SD relative to LD (mean ± SEM). Circles and the hatched bar indicate missing diurnal rhythm in overall cosinor analyses with combined datasets of all animals per treatment (significant diurnal rhythm at P < 0.05, refer to Table 1). Pairwise comparisons were performed with two-tailed, unpaired Student's t-tests (total leukocytes, NK cells, eosinophils, total Th cells, cytotoxic T cells, γδ T cells, Ag-exp. Th cells, plasma cortisol concentration, hematocrit), two-tailed unequal variance t-tests (T cells, monocytes, activity behavior), or two-tailed Mann–Whitney U-tests (neutrophils, naive Th cells); refer to Table S7 for statistical details, ***P < 0.001, **P < 0.01, ns P ≥ 0.05.

