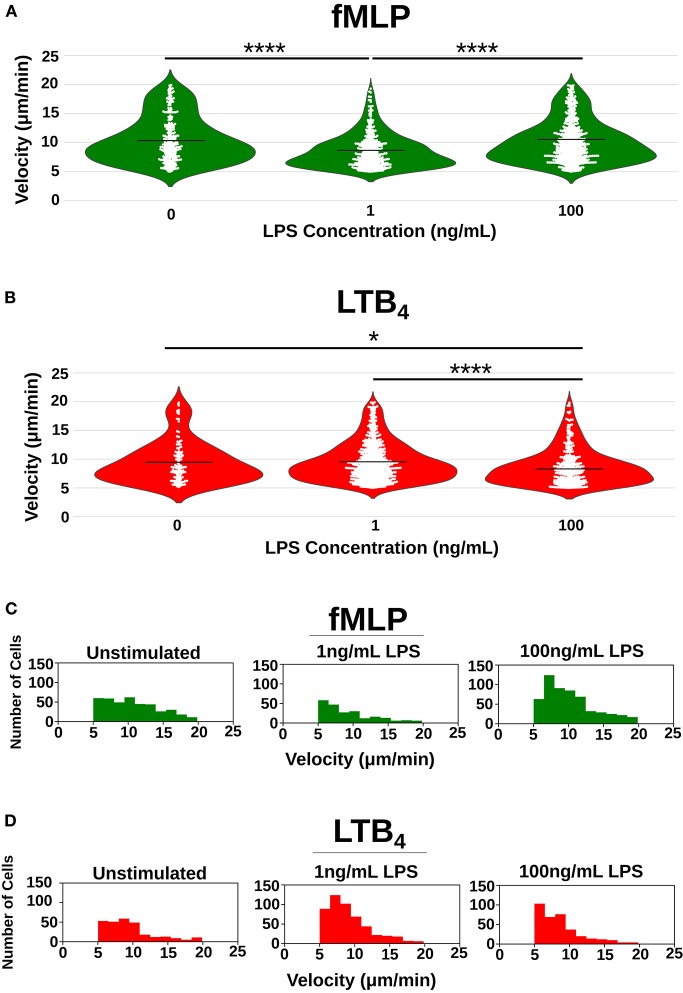
Figure 4.
Single-cell quantification of the effect of LPS priming on neutrophil velocity. Velocity [μm/min] of individual neutrophils as they migrate toward fMLP (green) and LTB4 (red) recorded as a single circle on the plot. (A) Violin plots depicting distribution of single-cell velocities of neutrophils migrating toward fMLP in the unstimulated group (n = 404), super-low dose stimulated group (n = 222), and high-dose stimulated group (n = 557) where each white dot represents the velocity of a single-cell. High dose LPS [100 ng/mL] increases the mean velocity of dHL-60 cells migrating toward fMLP, whereas low dose LPS decreases the mean velocity of dHL-60 cells migrating toward fMLP. (B) Violin plots depicting distribution of single-cell velocities of neutrophils migrating toward LTB4 in the unstimulated group (n = 123), super-low dose stimulated group (n = 667), and high-dose stimulated group (n = 349) where each white dot represents the velocity of a single-cell. Super-low dose LPS [1 ng/mL] increased the mean velocity of dHL-60 cells migrating toward LTB4. (C) Histogram depicting distribution of velocities of neutrophils migrating toward fMLP in all three-treatment groups. Super-low dose LPS negatively shifts distribution of cell velocity, whereas high-dose LPS positively shifts distribution of cell velocities toward fMLP. (D) Histogram depicting distribution of velocities of neutrophils migrating toward LTB4 in all three treatment groups. Super-low dose LPS positively shifts distribution of cell velocity, whereas high-dose LPS negatively shifts distribution of cell velocities toward fMLP. Data is representative of one experiment, however experiment was repeated at least 3 times. *p < 0.05, ****p < 0.0001.

