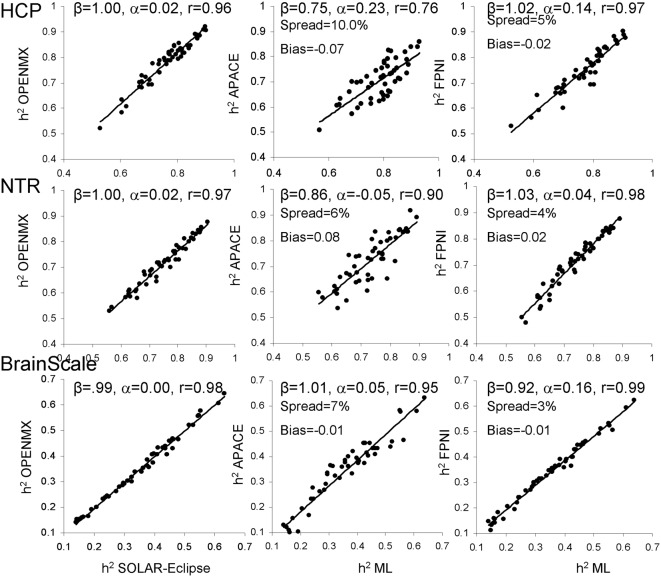
Figure 3.
The scatter plot of heritability estimates for 49-regional FA values calculated by ENIGMA-DTI pipeline and then normalized using the trait normalization function in SOLAR-Eclipse. Heritability estimates for two approximation approaches were plotted vs. the average estimate obtained for two ML-based methods: SOLAR-Eclipse and OpenMX. The lines represent linear regression fit vs. ML-based estimates with slope (β), intercept (α) and Pearson correlation values (r).

