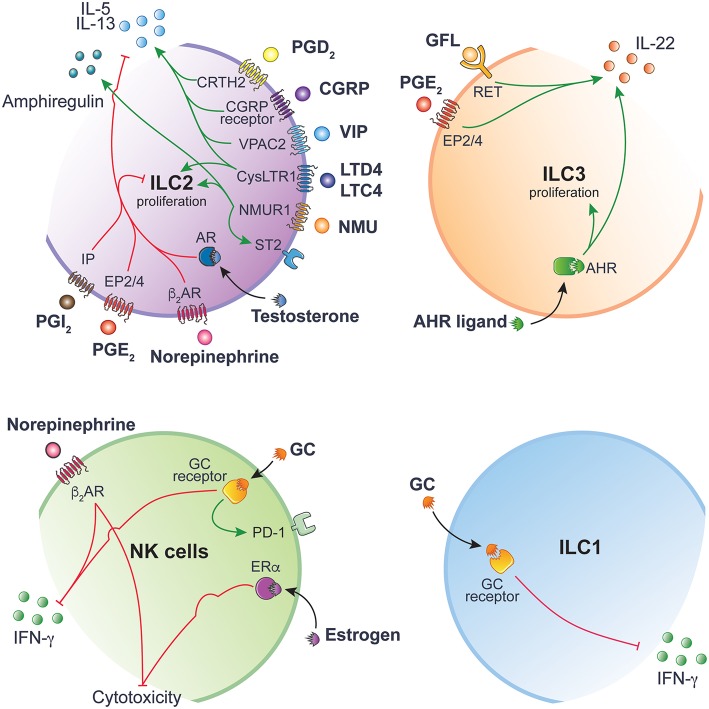
Figure 2.
ILC function is tightly regulated by ligand-receptor interactions. Inhibitory and activating intracellular pathways are colored in red and green, respectively. This figure has been drawn using Servier Medical Art (https://smart.servier.com) and modified by the authors under the following terms: Creative Commons Attribution 3.0 Unported License.

