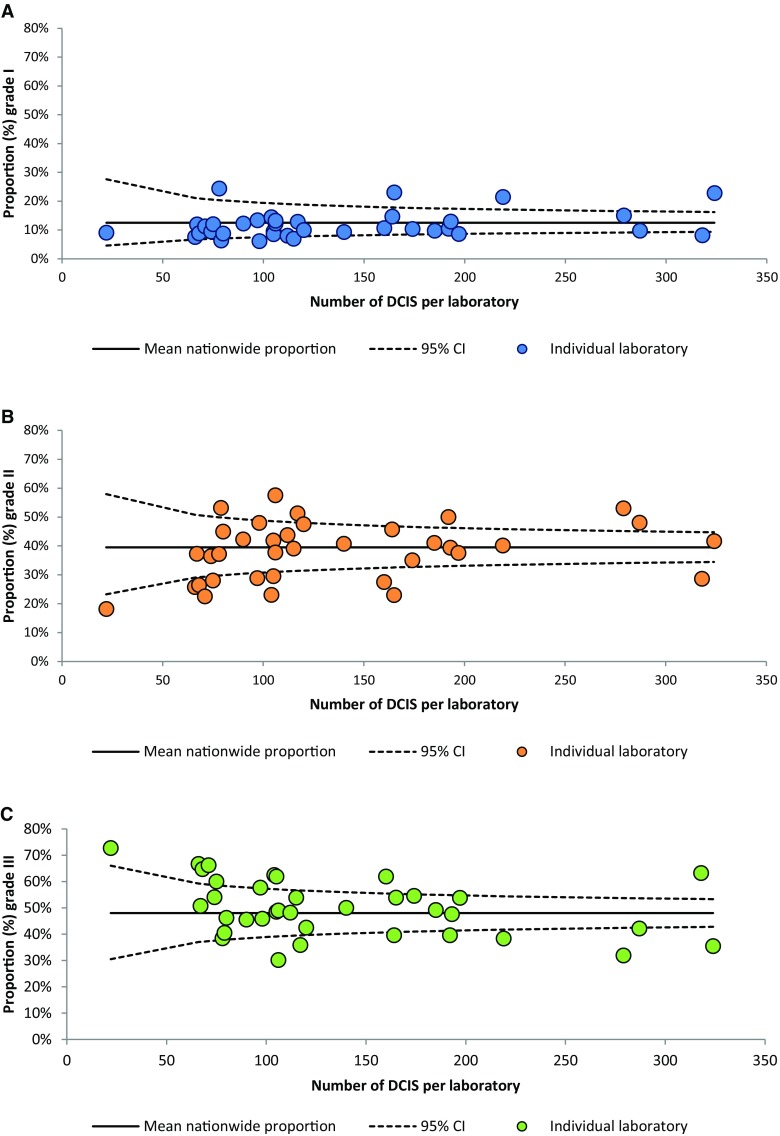
Fig. 2.

Funnel plots showing the observed proportion of ductal carcinoma in situ (DCIS) of the breast per grade per laboratory (dots) relative to the national proportion and its 95% confidence intervals for DCIS grades I (a), II (b), and III (c) (2013–2016)
