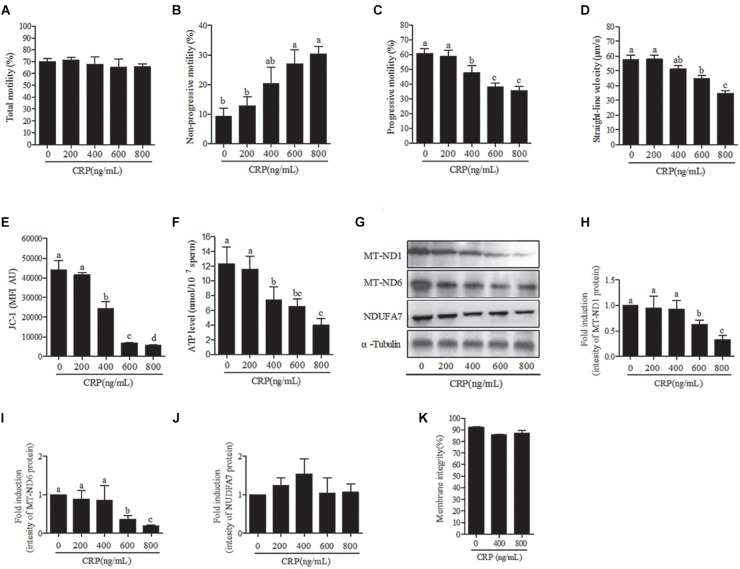
FIGURE 4.
Effect of D-chloramphenicol (CRP) on boar sperm at 3 h incubation with different doses (0, 200, 400, 600, 800 ng/mL). (A–F) Dose-dependent changes in the sperm (A) total motility, (B) non-progressive motility, (C) progressive motility, (D) straight-line velocity, (E) mitochondrial activity, and (F) ATP level. (G) Western blotting image showing the expression of the MT-ND1, MT-ND6, NDUFA7, and α-tubulin. (H–J) Quantitative expression of the MT-ND1, MT-ND6, and NDUFA7 over α-tubulin (control) generated from western blotting. (K) Membrane integrity measured in sperm. Values are means ± SEM of three replicates. Columns with different lowercase letters differ significantly (p < 0.05).

