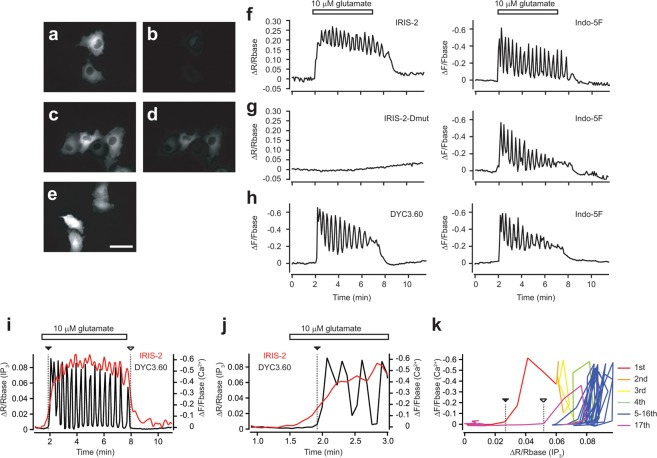
Figure 2.
Effect of FRET sensors to [Ca2+] dynamics in HeLa cells. (a–d) Fluorescent images of IRIS-2 expressing cells without (a,b) and with HaloTag TMR staining (c,d). Bar, 50 μm. Emissions detected by filters for GFP are shown in (a,c). Emissions detected by filters for TMR are shown in (b,d). (e) A fluorescent image of DYC3.60 expressing cells. (f–h) Effect of FRET sensors to [Ca2+] dynamics in HeLa cells. Cells expressing IRIS-2 (f), IRIS-2-Dmut (g), or DYC3.60 (h) were stained with HaloTag TMR and Indo-5F. Left panels are time courses of emission ratio (f,g) or emission (h) changes of FRET sensors in mGluR5 expressing HeLa cells stimulated with 10 μM glutamate (horizontal bars). Right panels are time courses of emission changes of Indo-5F in the same cells of left panels. (i–k) [IP3] and [Ca2+] changes were imaged with the dual FRET probes. Initiation of the first Ca2+ spike and the termination of Ca2+ oscillations were marked with dashed line with closed and open triangles, respectively. (j) [IP3] and [Ca2+] changes around the rise of first Ca2+ spike. (k) A phase plane trajectory is drawn with [IP3] and [Ca2+] imaging data.

