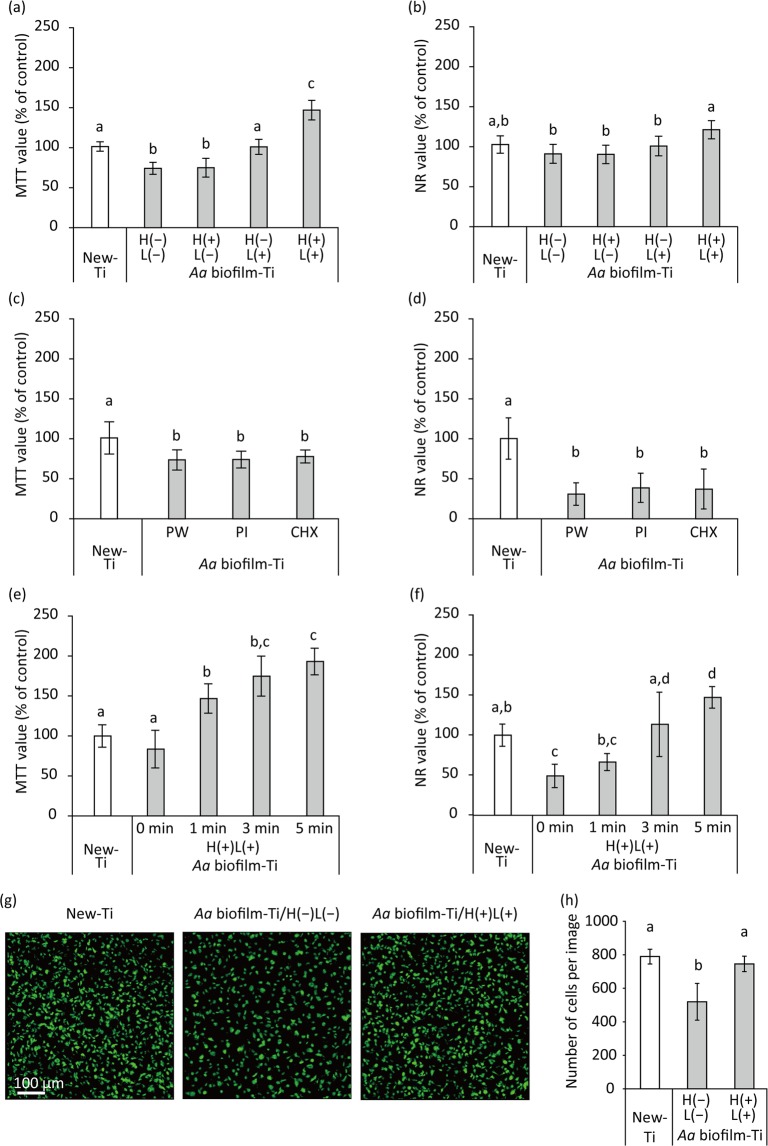
Figure 6.
Proliferation of MC3T3-E1 osteoblastic cells cultured on A. actinomycetemcomitans biofilm-contaminated titanium (Aa biofilm-Ti) treated with H2O2 photolysis, as assessed by methyl thiazolyl tetrazolium (MTT) assays, neutral red (NR) assays, and confocal scanning laser microscopy (CLSM). Aa biofilm-Ti was subjected to ultrasound scaling followed by each treatment and then cells were cultured on the treated specimens for 3 d before the assays were performed. (a,b) Relative optical density values obtained via MTT (MTT value) and NR (NR values) assays for cells grown on Aa biofilm-Ti that were immersed in 3% H2O2 and irradiated with 365 nm LED, either alone or in combination denoted as H(−)L(−), H(+)L(−), H(−)L(+), or H(+)L(+), for 5 min. (c,d) Relative MTT and NR values for cells grown on Aa biofilm-Ti treated with pure water (PW), 0.5% (w/v) povidone-iodine (PI), and 0.2% (w/v) chlorhexidine gluconate (CHX). (e,f) Relative MTT and NR values for cells grown on Aa biofilm-Ti treated with H(+)L(+) for 1, 3, and 5 min. (g) Representative CLSM images of MC3T3-E1 osteoblastic cells cultured on New-Ti and Aa biofilm-Ti treated with H(−)L(−) and H(+)L(+) for 5 min. Cell nuclei were stained with SYTO9. (h) Cell quantification. Parameter values for cell proliferation on Aa biofilm-Ti were significantly lower than those for cells grown on New-Ti. However, H(+)L(+) treatment recovered the reduction in cell proliferation induced by Aa biofilm contamination. Values and error bars in the graphs indicate the mean and standard deviation, respectively [n = 6 for (a–f) and n = 9 for (h)]. Different letters above the columns in the graphs refer to significant differences (p < 0.05) between different groups. H(−)L(−), treatment with pure water in a light-shielding box; H(+)L(−), treatment with 3% H2O2 in a light-shielding box; H(−)L(+), 365-nm LED irradiation of sample in pure water; H(+)L(+), 365-nm LED irradiation of sample in 3% H2O2.

