
Figure 1.
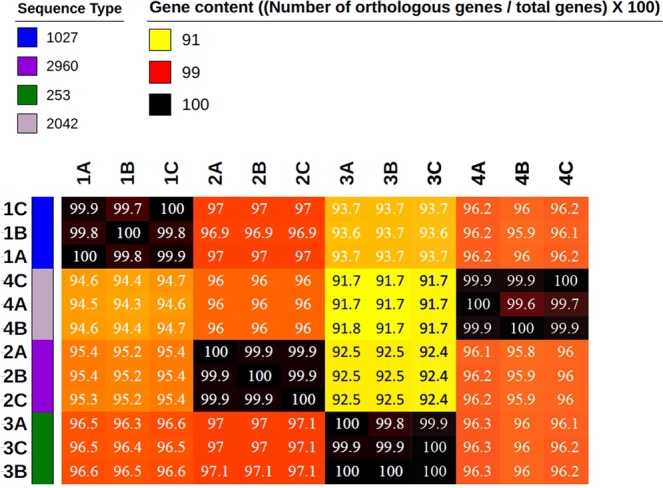
Pan genomic analyses of the 12 isolates: heatmap representation of the gene content comparison between all isolates. The gene content is calculated as the number of orthologous genes between two isolates/the total number of genes.
Official websites use .gov
A
.gov website belongs to an official
government organization in the United States.
Secure .gov websites use HTTPS
A lock (
) or https:// means you've safely
connected to the .gov website. Share sensitive
information only on official, secure websites.
Pan genomic analyses of the 12 isolates: heatmap representation of the gene content comparison between all isolates. The gene content is calculated as the number of orthologous genes between two isolates/the total number of genes.