Figure 7.
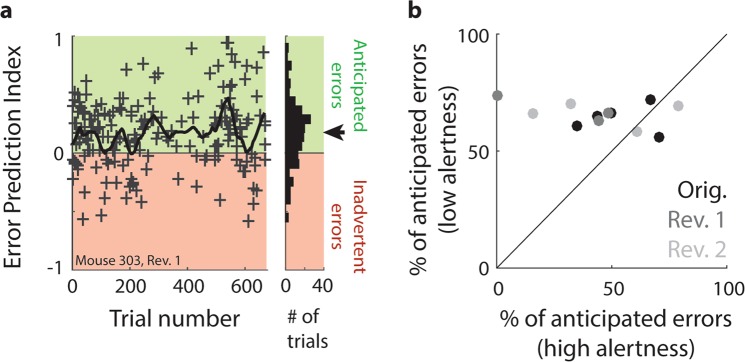
Individual errors can be identified as anticipated or inadvertent. (a) Left: Example of the classification process for individual error trials across the first reversal training of one animal. Each error trial is assigned an Error Prediction (EP) index based on the normalized difference in reaction time, path surplus, running speed and lick location compared to the surrounding ± 10 hit trials. Crosses: EP index for one individual error trial. Errors with an EP index > 0 (green background shade) are defined as anticipated, errors with an EP index < 0 (red background shade) as inadvertent. Right-hand inset: Distribution of EP indices across the course of training. Black arrow: Mean EP index. (b) Relation between the proportion of anticipated errors made during spontaneous states of high and low alertness (as defined by local PR scores, see Methods), respectively. Shown are five animals in the original task (black dots) and two reversals (dark and light grey dots, respectively), with three measurements missing due to an insufficient overall number (n < 5) of error trials. Data points are concentrated above the diagonal (*p < 0.05; based on t-test for dependent samples), indicating that the proportion of anticipated errors is significantly smaller during high than low alertness.

