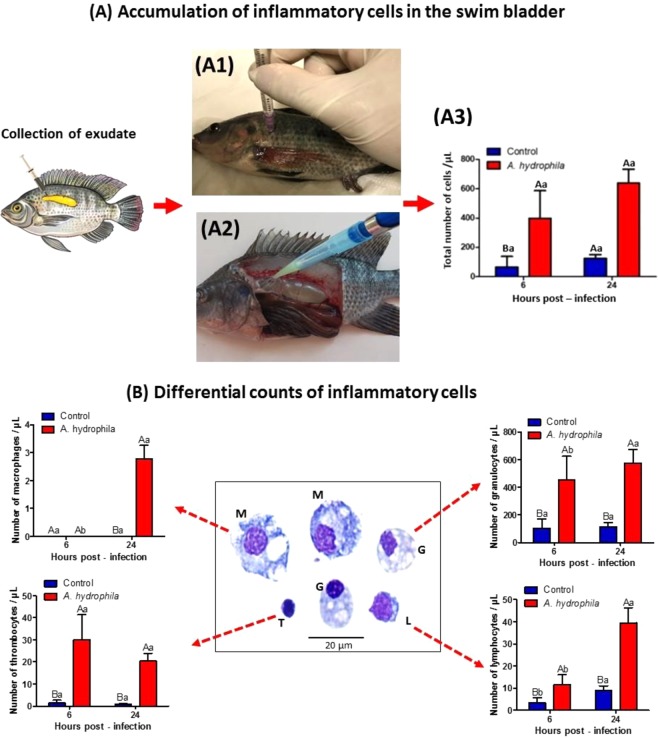
Figure 6.
(A) Inflammatory cells presented in the exudate collected from swim-bladder. (A1) Anesthetized tilapia for bacterial inoculation in the swim bladder. (A2) At necropsy, collection of exudate from the swim bladder after lateral-left opening of the tilapia peritoneal cavities. (A3) Total cell counts observed in the exudate. (B) Differential counting of cells from the swim bladder exudate, and the morphology of cells in the inflammatory lesion. “G” (Granulocytes showed elliptical nuclei with small nonstained cytoplasmic granules), “T” (Thrombocytes presented a small nucleus:cytoplasm ratio and nuclei appearing mainly at the cell’s perimeter), “L” (Lymphocytes, small and spherical cells, with basophilic cytoplasm and apparently without granulations) and “M” (Macrophages, the largest cells observed in the exudates and exhibited cellular pleomorphism). Stained by May-Grünwald-Giemsa-Wright. Mean values (n = 10) and ANOVA observed for total cells and differential counting of cells present in the exudate during acute inflammatory response in tilapias 6 and 24 HPI. Means followed by the same letter do not differ by the Tukey test (P < 0,05). The variance analysis is represented by capital letters to compare the different treatments within each experimental period, lowercase letters to compare the evolution of each treatment in the different experimental periods. Different letters indicate significant difference (p < 0.05).

