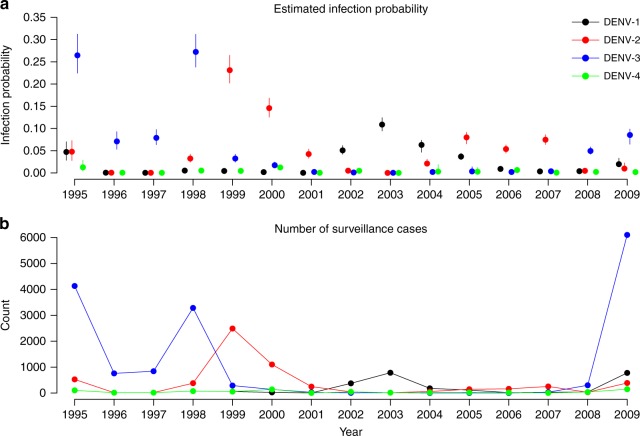
Fig. 1.
Estimated probabilities of infection and reported numbers of cases by serotype and year. Serotypes are colored in black for DENV-1, red for DENV-2, blue for DENV-3, and green for DENV-4. a The model-predicted serotype-specific probabilities of infection. Points and vertical bars indicate posterior medians and 95% credible intervals. b The number of surveillance-reported cases in Managua, Nicaragua, from 1995 to 2009. The year is defined as July of a year to June of the next year, to be consistent with the dengue season in the study region. Serotype-specific surveillance counts were imputed using information obtained from PAHO and literature (Supplementary Methods). Source data are provided as a Source Data file

