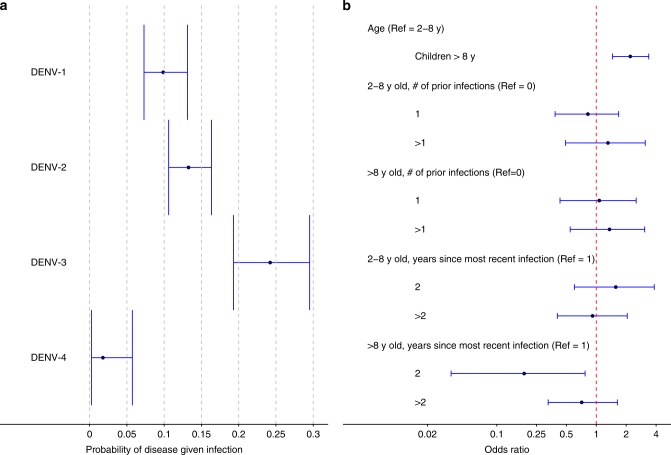
Fig. 3.
Estimated probabilities of disease given infection and effects of risk factors. Points and vertical bars indicate posterior medians and 95% credible intervals. a Serotype-specific probability of disease given infection. b Association of the risk of disease given infection with serostatus at entry, age group, and years since most recent infection. The reference group is children aged 2–8 years, without prior infection. Source data are provided as a Source Data file

