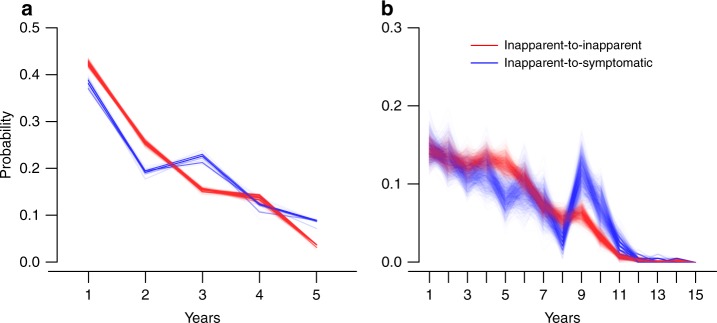
Fig. 4.
Posterior distribution of the time interval between consecutive infections. Results are colored in red for the time between inapparent infections and in blue for the time between an inapparent infection and a symptomatic infection. a Estimation is restricted to infections that occurred during the study. b Estimation is based on the proposed method combining the study period and the years before study entry. Source data are provided as a Source Data file

