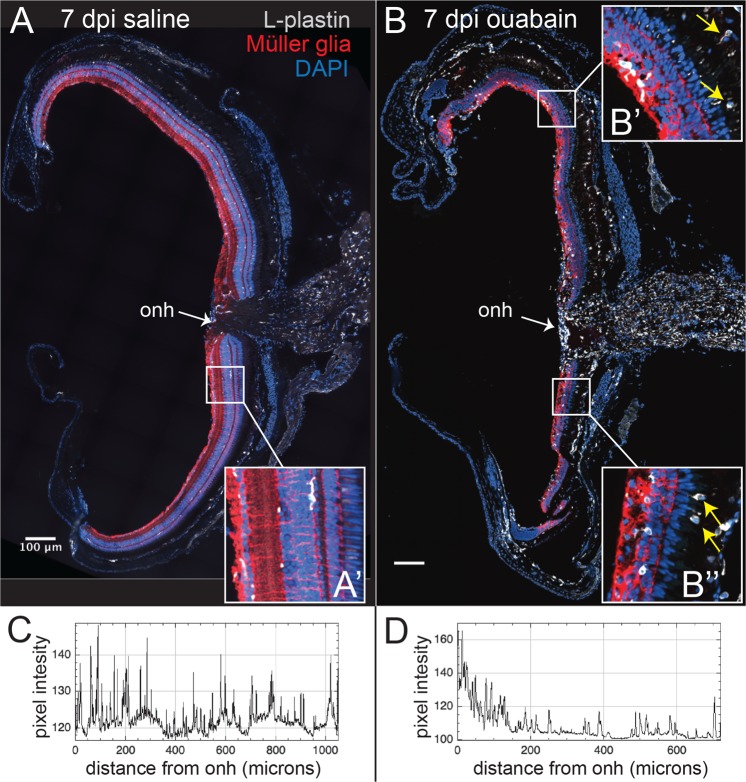
Figure 1.
Immune cell features and distribution in regenerating retinal tissue. Images show retinal cryosections at 7 days post injection (7 dpi) of saline (A) or 2 μM final concentration of ouabain (B) stained for L-plastin (gray; microglia/macrophages), Glutamine Synthetase (GS, red; Müller glia), and DAPI (blue; nuclei). A and B show stitched images of entire cryosections, insets (A’, B’, and B”) show indicated enlarged regions. Müller glia in retinas 7 dpi ouabain display hypertrophy throughout the regenerating inner retina and appear disorganized (B’,B”) compared to control (A’). (C,D). Plots show pixel intensity of L-plastin+ signal as a distance from the optic nerve head (onh). L-plastin+ cells in saline injected retinas show even distribution and are ramified (A, A’,C), while L-plastin+ cells in regenerating retinas (B-B”) appear irregularly dispersed (D) and display ameboid morphology. B’ and B” reveal that the L-plastin+ cells in the inner retina conform to the network of Müller glial cells labeled by GS expression. In addition, L-plastin+ cells are densely localized in regions corresponding to the optic nerve head (onh) at 7 dpi ouabain, and several immune cells appear in regions apical to the retina with directional orientation that could suggest migration into retinal tissue from the RPE or outside of the retina (yellow arrows, B’ and B”). Scale bars in (A,B) = 100 μm.

