Figure 5.
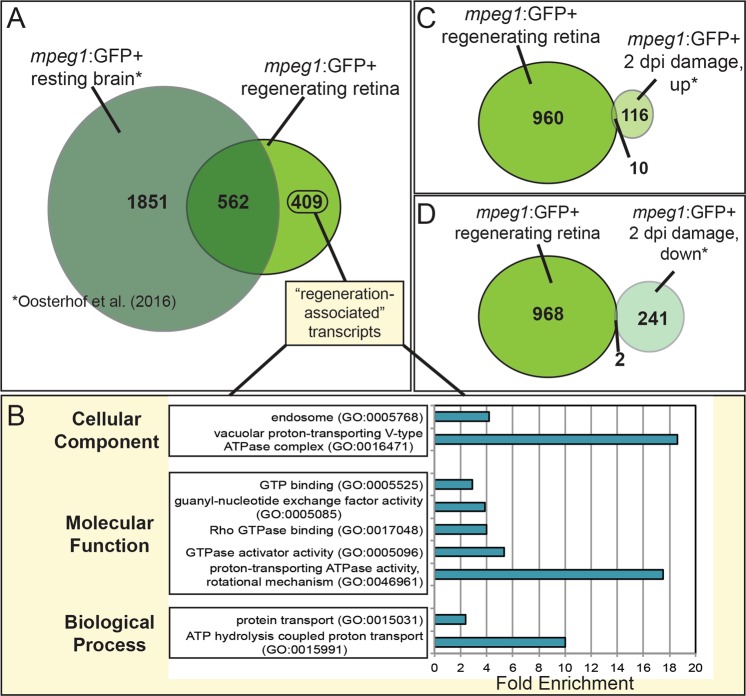
Identification of unique transcripts expressed by mpeg1:GFP+ cells during retinal regeneration. (A) The list of transcripts found to be enriched in mpeg1:GFP+ cells (log2FC > 2) during retinal regeneration (mpeg1:GFP+ regenerating retina, this study) was compared to that published to be enriched in mpeg1:GFP+ cells (log2FC > 2) obtained from steady-state (mpeg1:GFP+ resting brain, Oosterhof et al.12). “Regeneration-associated” transcripts (409 transcripts) are those found to be enriched in this study (with log2FC > 2), but not in mpeg1:GFP+ cells in steady-state brain (with log2FC > 2). (B) GO analysis of the 409 “regeneration-associated” transcripts shows enrichment of indicated categories in Cellular Component, Molecular Function, and Biological Process. P < 0.01 for all categories shown. (C) The list of transcripts found to be enriched in mpeg1:GFP+ cells in this study (again with log2FC > 2) was also compared to transcripts found to be upregulated or downregulated in mpeg1:GFP+ cells isolated from acutely damaged (with log2FC > 2, 2 dpi damage, up or down, (C,D) zebrafish brain (Oosterhof et al.12). Venn diagrams show the number of transcripts unique or shared between the two studies. Collectively, these comparisons indicate that microglia/macrophages adopt a unique transcriptional program in the context of retinal regeneration. dpi = days post injury.

