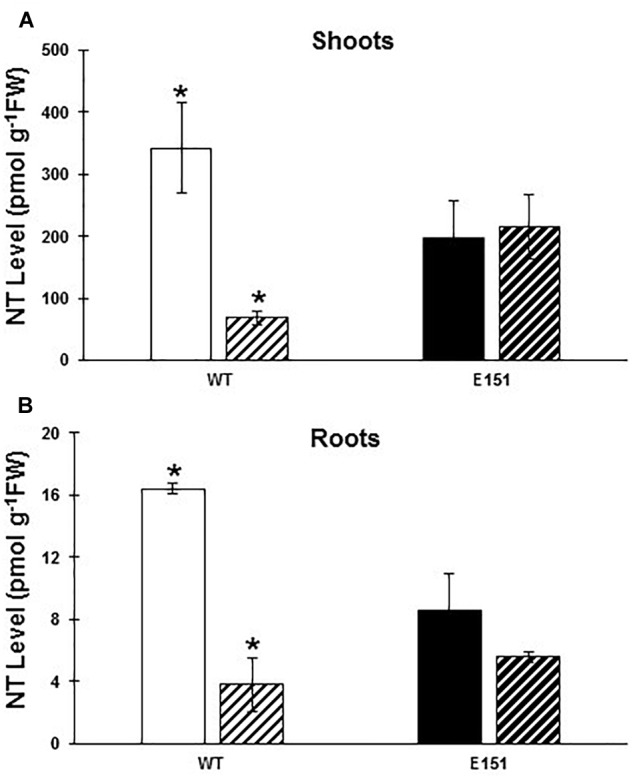
FIGURE 4.

Levels [pmol g-1 of fresh weight (FW)] of nucleotides (NT; transZNT, cisZNT, and iPNT) in the shoots (A) and the roots (B) of WT (white bars) and E151 (black bars) plants. Plants inoculated with R. irregularis (bars with hatched lines) or non-inoculated (solid bars) were harvested 13 days after planting. Data (mean ± SE; n = 3) were subjected to a Student’s t-test to determine significant differences between myc- and myc+ plants. An asterisk indicates significance at a 95% confidence level.
