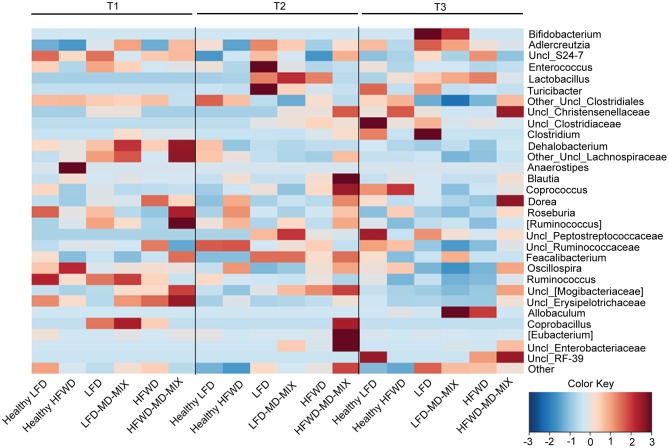
Figure 5.
Impact of diets, AOM-treatment and MD-MIX on gut microbiota composition. Genus level average fecal microbiota profiles at time points T1, T2, and T3 for all combinations of diet (LFD and HFWD) and supplementation (MD-MIX), expressed as heatmap with horizontal scaling. Bacterial genera present at a relative abundance >0.05% in at least one sample are plotted. The color scale from blue to brown indicates the z score (i.e., number of standard deviations from the mean, from −3 to 3) for each time point. The heatmap has been generated using the function heatplot within the R package MADE4.

