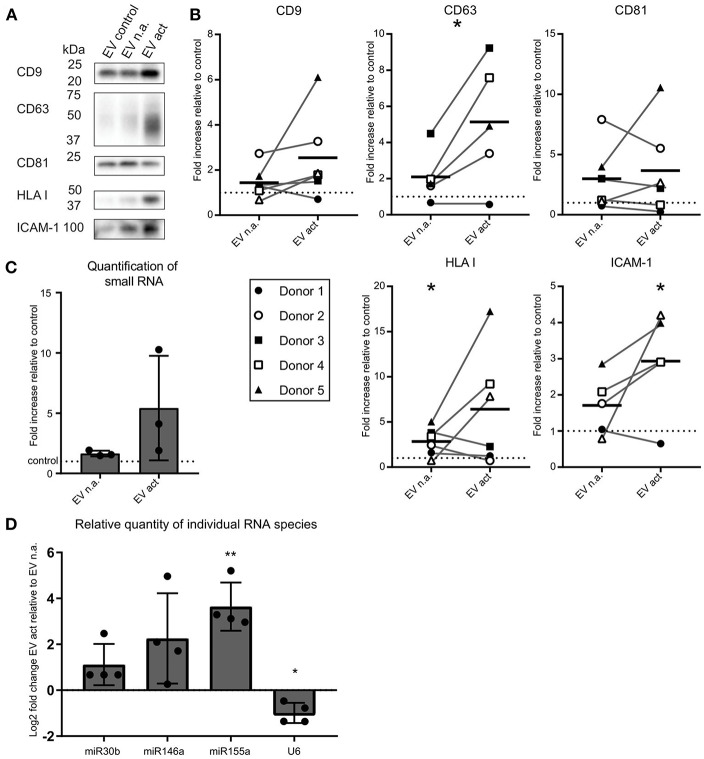
Figure 2.
Activated bystander T-cells modulate the release of EV-markers by LPS-stimulated moDC. (A) Western blot detection of markers in EV collected from moDC incubated with LPS only (control), or additionally with non-activated (n.a.) or activated (act) bystander T-cells. EV were isolated from the culture supernatant of equal numbers of moDC per condition. Representative experiment out of six independent experiments is shown. (B) Quantification of data as in (A) for five or six independent donors from six independent experiments. Independent experiments (donors) are each represented by individual symbols. Values are plotted relative to the signal obtained for the control condition ( moDC incubated with LPS only), represented by the dotted line. Horizontal lines indicate the mean. Asterisks placed above symbols indicate a significant difference between the data represented by these symbols and the control condition (Paired t-test, p < 0.05). Asterisks placed between the columns with symbols indicate a significant difference between the data represented by the two conditions (Paired t-test, p < 0.05) (C) Release of total small RNA in EV derived from LPS-experienced moDC is increased upon addition of bystander T-cells, especially activated bystander T-cells. Quantification of relative amounts of small RNA isolated from EV pellets from co-culture supernatant, as measured with Bioanalyzer Pico. Data are from three independent donors in three independent experiments. The control condition is represented by the dotted line. (D) qPCR detection of specific small RNA species in EV pellets collected from LPS-matured moDC incubated with non-activated (EV n.a.) or activated (EV act) bystander T-cells. Changes in (mi)RNA levels of EV act are depicted as log2-fold-change relative to EV n.a. U6 refers to the small nuclear snRNA species U6. Quantification of data from four independent donors in four independent experiments. Asterisks placed above columns indicate a significant difference between the data represented by the column and the control condition. Paired t-test *p < 0.05, **p < 0.01.

