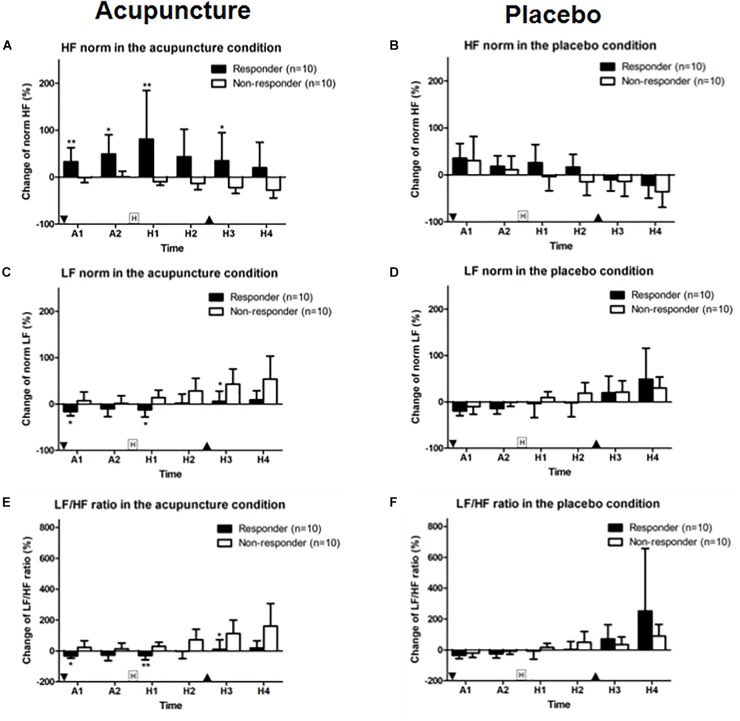
FIGURE 6.
Change in HF and LF norm and LF/HF ratios: (A,B) HF norm, (C,D) LF norm, and (E,F) LF/HF ratio for acupuncture and placebo stimulation between responder and non-responder groups. Values are mean (95% CI). “Squared H” indicates time points for histamine stimulus. “Inverted triangle” indicates time point for insertion of acupuncture and “triangle,” removal of acupuncture. P-values are for independent sample t-tests comparing changes in heart rate variability from baseline between groups. ∗p < 0.05, ∗∗p < 0.01. A1 is 0–5 min and A2 is 5–10 min after intervention. Relative to histamine stimulus, H1 is 0–5 min, H2 is 5–10 min, H3 is 10–15 min, and H4 is 15–20 min.

