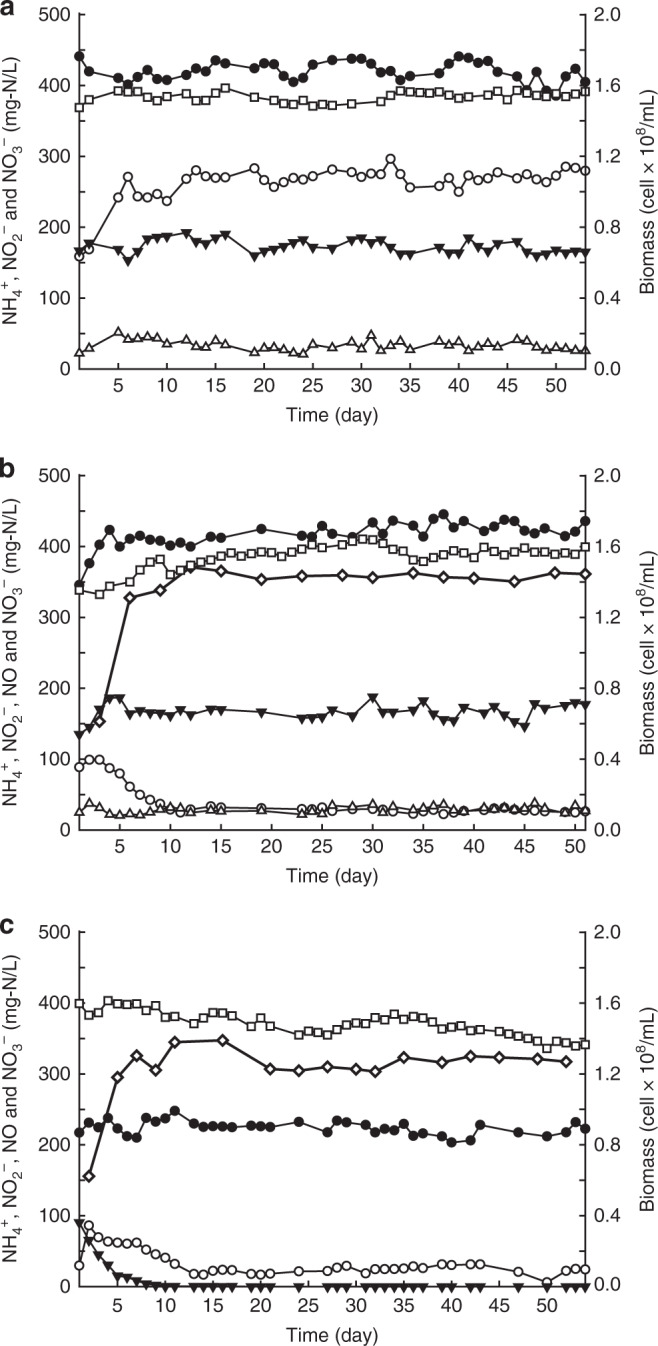
Fig. 1.

Nitric oxide, nitrite, ammonium consumption, nitrate production, and biomass growth during reactor operation. (a) reactor I (control reactor, supplied with ammonium and nitrite), (b) reactor II (supplied with ammonium, nitrite, and NO) and (c) reactor III (supplied with ammonium and NO). Filled and empty circles indicate ammonium concentration in the influent and effluent, respectively. Empty triangles indicate nitrite concentration in the influent. Nitrite concentration in the effluent was always below detection limit. Filled triangles indicate nitrate concentration in the effluent. Cell concentration is displayed by cell numbers per ml (open squares). Nitric oxide (empty diamonds) is displayed as consumption by the bioreactors. This is calcualted from the difference between concentration of nitric oxide in the influent and effluent of the gas phase of the bioreactor. The source data underlying this figure are provided as Source Data file
