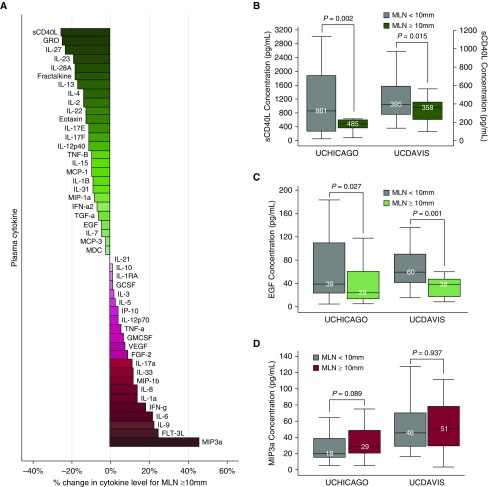
Figure 3.
(A) Bar graph shows percentage change in plasma cytokine concentrations for mediastinal lymph nodes (MLNs) ≥10 mm within the University of Chicago (UCHICAGO) primary cohort (n = 116). The color of each bar represents the directionality of the change (red indicates positive change; green indicates negative change). (B) Soluble CD40 ligand (pg/ml) stratified by MLN diameter in patients with unclassifiable interstitial lung disease (ILD) or interstitial pneumonia with autoimmune features (IPAF) within the UCHICAGO primary cohort (n = 36) and the University of California Davis (UCDAVIS) replication cohort (n = 34). (C) Epidermal growth factor (pg/ml) stratified by MLN diameter in patients with unclassifiable ILD or IPAF within the UCHICAGO primary cohort (n = 36) and the UCDAVIS replication cohort (n = 34). (D) MIP3a (pg/ml) stratified by MLN diameter in patients with idiopathic pulmonary fibrosis, chronic hypersensitivity pneumonitis, or chronic hypersensitivity pneumonitis–ILD within the UCHICAGO primary cohort (n = 80) and the UCDAVIS replication cohort (n = 84). Group comparisons for patients with MLNs ≥10 mm (green or red) to patients with MLNs <10 mm (gray) were conducted using the Wilcoxon signed-rank test for matched nonparametric data. All comparisons of cytokine concentrations were conducted in 10,000 bootstrap replications to improve precision at the 95% confidence interval level. EGF = epidermal growth factor; sCD40L = soluble CD40 ligand.

