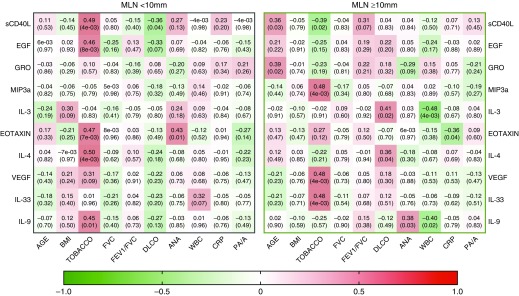
Figure 4.
Correlation of top cytokines with clinically acquired biologic variables stratified by mediastinal lymph node (MLN) size. Left panel depicts correlation matrix for MLNs <10 mm, whereas right panel depicts correlation matrix for MLNs ≥10 mm. Cytokine correlation with clinical variable was determined by Pearson’s correlation algorithm and is displayed in the corresponding box (coefficient of r value on top and P value in parentheses). The color of each box represents the directionality of the correlation (red indicates positive correlation; green indicates negative correlation). The bar below scales the degree of correlation. Pearson’s correlation was used to determine the significance of correlation (P < 0.05) between the concentrations of individual cytokines with clinical variables as shown above. ANA = antinuclear antibody; BMI = body mass index; CRP = C-reactive protein; PA/A = pulmonary artery/aorta ratio; WBC = white blood cell.

