
Figure 5.
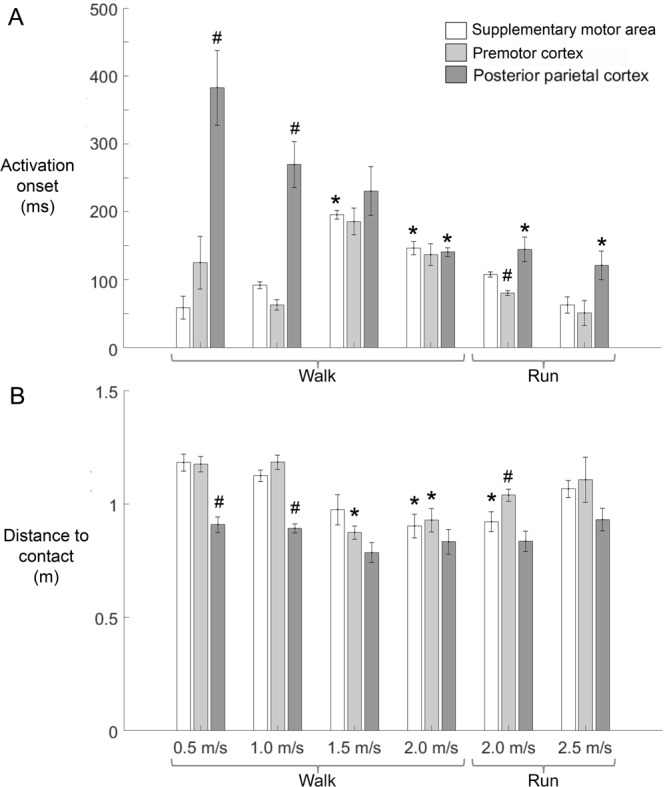
Summaries of activation onset time and distance to contact by speed and cortical cluster. (A) Activation onset time: earliest significant spectral power change, and (B) distance to contact: distance between the obstacle and subject at activation onset. Mean ± standard error. #cortical clusters differ at given speed, *speeds differ within cortical cluster. Friedman tests by speed and cortical cluster with Tukey-Kramer adjustments for multiple comparisons (p < 0.05).