
Figure 3.
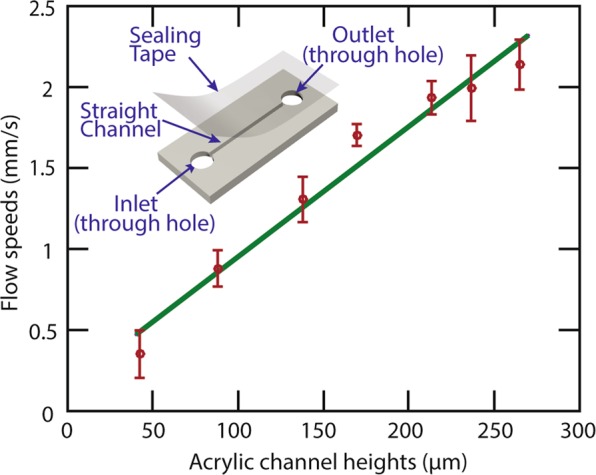
Flow speed characterization. The red dots represent the experimentally acquired flow speeds in channels with different heights. The green line is the linear fitting between the flow speed and the acrylic channel height. The inset schematic shows the acrylic device used for the characterization. The uncertainty of each data point was determined by the standard deviation obtained from 5 independent experiments with the same channel.