Figure 1.
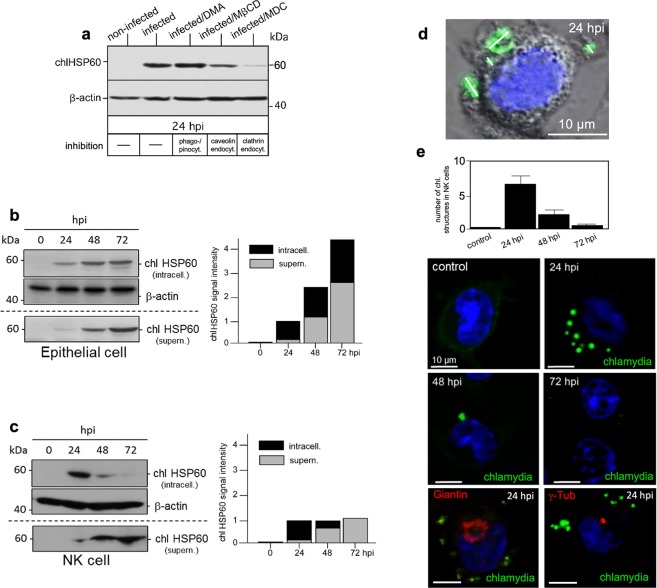
Chlamydial infection of KY-2 cells. (a) KY-2 cells were infected for 24 h in the presence of inhibitors blocking cellular uptake (100 µM DMA, 10 mM MβCD, 200 µM MDC)94. Lysates were analysed by Western blot probed for chlHSP60 and β-actin. (b,c) Western blots (left) of infected KY-2 and MN-R cells showing chlHSP60 in lysates (intracell.) and culture supernatants (supern.). β-actin served as a loading control. chlHSP60 signals were determined by densitometric analysis (right). chlHSP60 signal intensities in cells (black column part) and supernatants (grey column part) are shown. The signal of total chlHSP60 at 24 hpi was set to 1. (d) Depicts an infected KY-2 cell (24 hpi) stained for chlamydial LPS (green) overlaid on the phase-contrast image. DNA is visualized with DAPI (blue). The size of bacterial structures are indicated by white lines. (e) KY-2 cells were infected or not with chlamydia (0–72 hpi, MOI 40) and stained for chlamydia (green) and DNA (DAPI, blue). A total of 200 cells was counted from 10 random fields of view (63x objective) to determine the number of chlamydial structures in infected NK cells (0–72 hpi). The results are shown in the top panel of (e). Infected KY-2 cells (MOI 40 and 24 hpi) were also co-stained for chlamydia (green), DNA (DAPI, blue), Giantin (Golgi, red) or γ-tubulin (MTOC, red). 55–75% of the KY-2 cells were infected. (a,b,c) Depict cropped blots obtained by each protein evaluation. Full-length blots are shown in the Supplementary Figs S4, S5 and S6, respectively.

