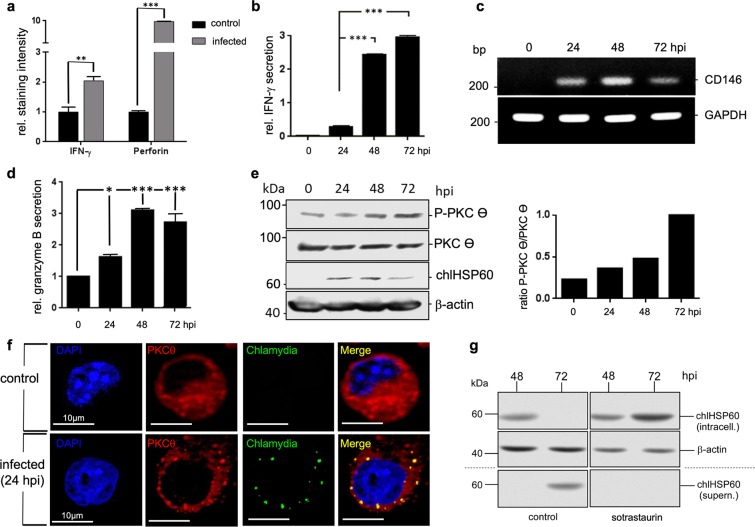
Figure 3.
Functional activation of KY-2 cells during chlamydial infection. (a) Flow cytometric analysis of IFN-γ and perforin expression of infected KY-2 cells (MOI 40, 48 hpi). The plot shows the staining intensity of IFN-γ- and perforin-positive KY-2 cells compared with the value for non-infected cells, which was set to 1. Statistical analysis was performed as described in methods (**p < 0.01 and ***p < 0.001 vs. control (non-infected), n = 3). (b) ELISA of IFN-γ secretion of infected KY-2 cells. The plot displays the relative amount of IFN-γ secretion as means ± SD. The maximum value at 72 hpi was set to 3. (c) RT-PCR of CD146 transcript levels in uninfected and infected KY-2 cells (0–72 hpi). Amplicons were separated on a 1% agarose gel. GAPDH served as a control. The plot in (d) shows the relative granzyme B secretion from infected KY-2 cells (MOI 40, 0–72 hpi) measured by ELISA. The values obtained for non-infected cells were set to 1 (*p < 0.05 and ***p < 0.001 vs. control (non-infected), n = 3). (e) Western blot of PKCΘ phospho-activation during KY-2 cell infection (left panel). KY-2 cells were infected or not with chlamydia (MOI 40) for 0–72 h and analysed by Western blots probed for P-PKCϴ, PKCϴ, and chlHSP60. β-actin served as a loading control. After densitometric analysis, the P-PKCϴ/PKCϴ ratio was plotted for the different time points of infection (right panel). (f) Immunofluorescence showing the co-localization between PKCϴ (red) and chlamydia (green) in infected NK cells (MOI 40, 48 hpi). (g) Western blot of chlHSP60 in infected KY-2 cells (MOI 40) and culture supernatants in the presence of sotrastaurin (250 nM). β-actin served as a loading control. (e and g) Depict cropped blots obtained by each protein evaluation. Full-length blots and the original agarose gel image (c) are shown in the Supplementary Figs S8, S9, and S10, respectively.

