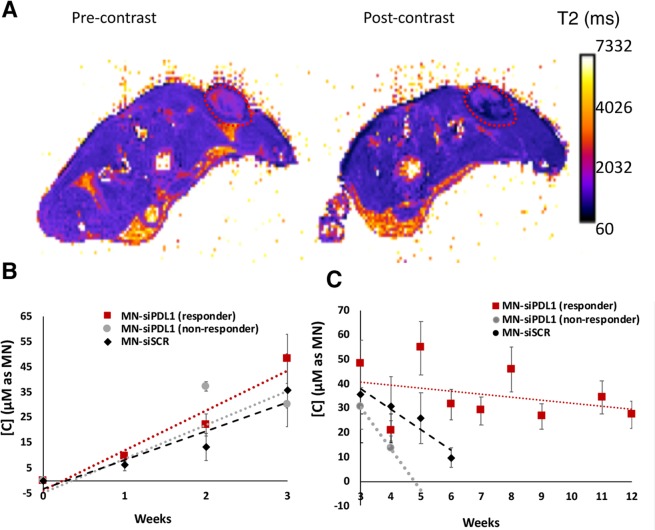
Figure 2.
Image-guided delivery of MN-siRNA to tumors. (A) T2 maps of tumor bearing animals. The localization of MN-siPDL1 in tumor tissue caused shortening of the T2 relaxation time and resulted in negative contrast as compared to the pre-contrast image. (B) MN-siPDL1 concentration measurements over the tumor region-of-interest (ROI) in experimental and control animals during the first 3 weeks of treatment. The accumulation rate of MN-siPDL1 was faster than that of MN-siSCR during the first three weeks of treatment. The accumulation rate of MN-siPDL1 in non-responder animals was intermediate. (C). MN-siPDL1 concentration measurements over the tumor region-of-interest (ROI) in experimental and control animals during weeks 3–12 of treatment. The concentration of the agent in the control group treated with MN-siSCR or in non-responder animals treated with MN-siPDL1 decreased faster than in the responder animals treated with MN-siPDL1.

