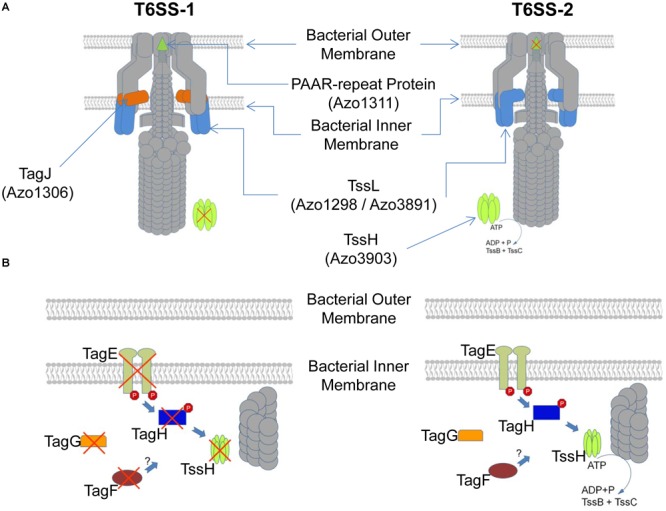
FIGURE 6.

Schematic depiction of differences in the T6SS-1 and T6SS-2 of A. olearius BH72 based on presence or absence of the respective protein encoding genes in either T6SS gene cluster. (A) Depiction of the T6SS apparatus. Components encoded in both gene clusters depicted in gray, a red cross indicating absence of the component. (B) Depiction of the expected post-translational regulatory cascade of each apparatus. Components encoded in both gene clusters depicted in gray, a red cross indicating absence of the component.
