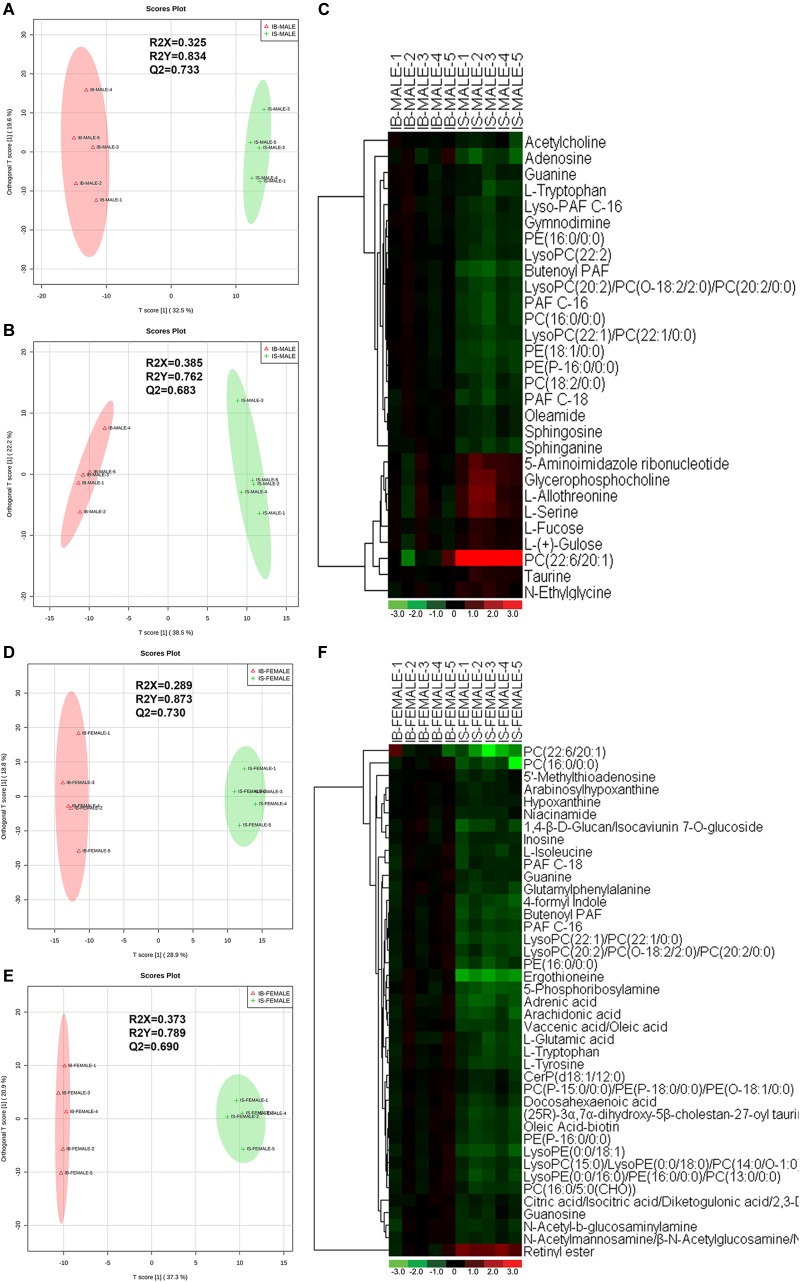
FIGURE 2.
Discrimination between the S. japonicum worms from SCID mice and those from BALB/c mice with S. japonicum infection for 35 days based on ESI+ and ESI- mode-derived metabolic phenotypes and heatmaps of the differential metabolites between the compared groups. (A,B): Orthogonal partial least-squares discriminant analysis (OPLS-DA) score plots in ESI+ mode (A) and ESI– mode (B) for comparison between male worms from SCID mice and those from BALB/c mice (IB-MALE denotes the male worms from BALB/c mice and IS-MALE denotes the male worms from SCID mice). (C): Heatmap of the differential metabolites between male worms from SCID mice and those from BALB/c mice. (D,E): Orthogonal partial least-squares discriminant analysis (OPLS-DA) score plots in ESI+ mode (D) and ESI– mode (E) for comparison between female worms from SCID mice and those from BALB/c mice (IB-FEMALE denotes the female worms from BALB/c mice and IS-FEMALE denotes the female worms from SCID mice). (F): Heatmap of the differential metabolites between female worms from SCID mice and those from BALB/c mice. For the heatmaps, normalized signal intensities (log2 transformed and row adjustment) are visualized as a color spectrum and the scale from least abundant to highest ranges is from –3.0 to 3.0 as shown in the colorbar. Green indicates decreased expression, whereas red indicates increased expression of the detected metabolites between compared groups. The sample size is 5 in each group of worm samples.

