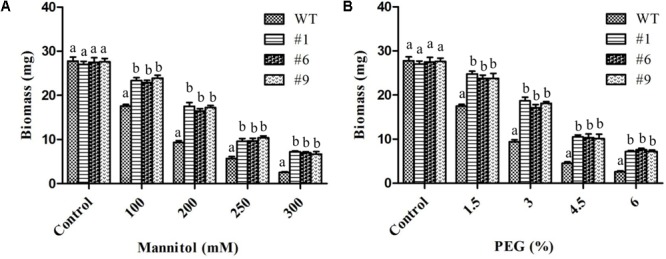
FIGURE 4.

Biomass of transgenic plants under mannitol and polyethylene glycol (PEG) induced stress. In vitro grown transgenic plants were used for biomass measurements after 10 days of stress. Histograms showing biomass of plants exposed to 100, 200, 250, and 300 mM mannitol (A) or 1.5, 3, 4.5, and 6% PEG (B). Values are means ± SE (n = 3). Different letters above the bars indicate significant differences (p < 0.05) as analyzed by Duncan Multiple Range Test applied to different transgenic and WT lines.
