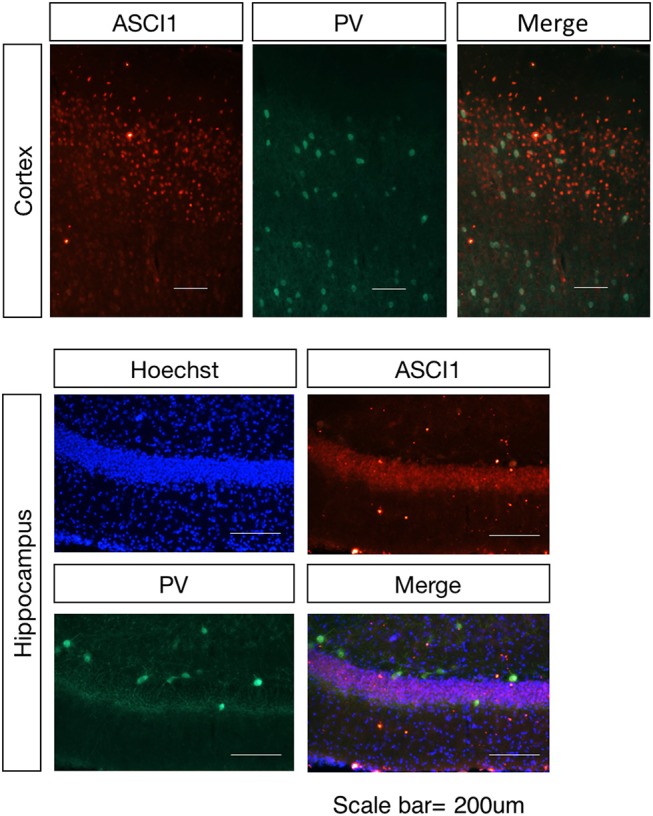
Figure 1.

Spatial distribution of the ASIC1 protein in the cortex and hippocampus regions. Representative images show coronal sections in the cortex and hippocampus region. The expression of ASIC1 in the cortex and hippocampus in red, PV-positive neuron represented in green. Scale bars indicate 200 μm.
