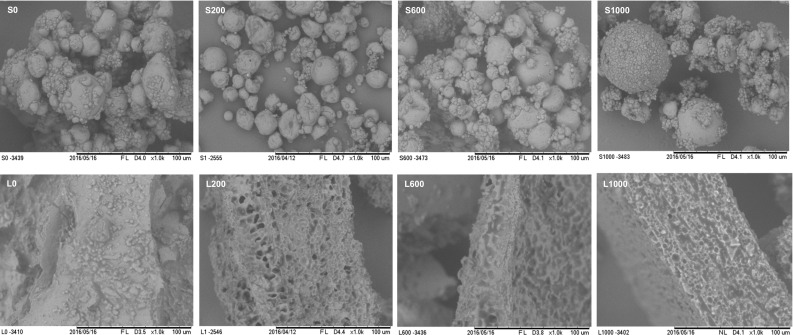
Fig. 2.

Micrographs obtained by scanning electron microscopy of dried treatments by spray dryer: S0, S200, S600 and S1000 (with 0, 200, 600 and 1000 ppm of sinapic acid, respectively); and treatments dried by freeze dryer: L0, L200, L600 and L1000 (with 0, 200, 600 and 1000 ppm of sinapic acid, respectively)
