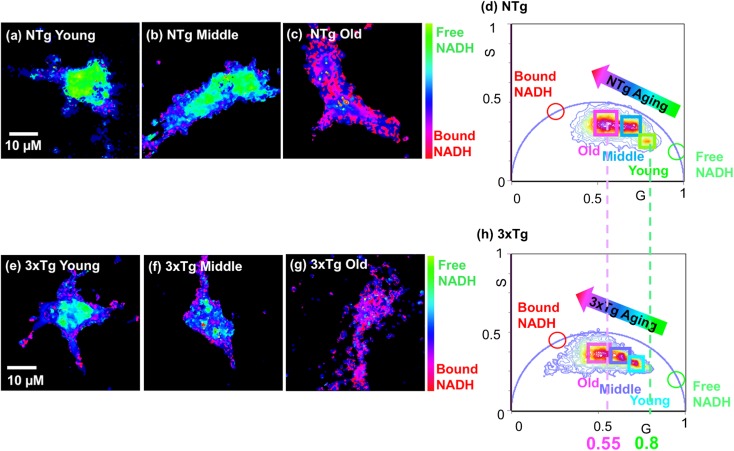
Fig. 2.
Aging promotes shifts toward more bound and less free NADH in NTg and 3xTg-AD neurons. FLIM color maps of young, middle, and old age neurons from NTg (a–c) and 3xTg-AD (e–g) mice illustrate a dramatically age-dependent depletion in free NADH level of both genotypes shown as the color shifts from more green-cyan (free NADH) to more pink-purple (bound NADH) with aging. Comparatively, the 3xTg-AD neurons present more bound NADH than the age-matched NTg neurons seen as a more pink-purple color in the age-matched 3xTg-AD neuron. (d, h) Phasor plots show the shift in distribution from free to bound NADH in neurons from young, middle, and old age neurons of NTg and 3xTg-AD brains, respectively. Each cluster that falls along the free-bound NADH trajectory (line between free and bound NADH) represents the combination of free and bound NADH from the corresponding single neuron in the colormap

