Figure 7.
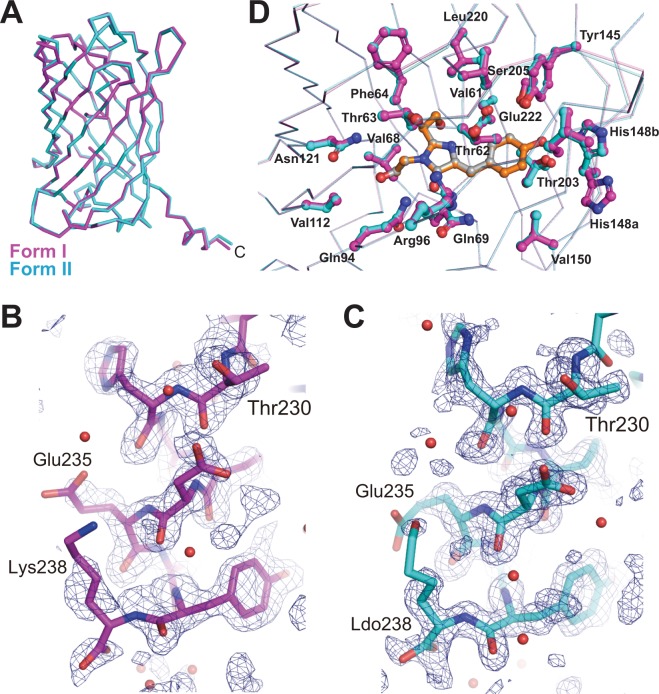
Crystal structures of GFPuv form I and form II. (A) Overall structure of GFPuv form I (magenta) and form II (cyan) are superimposed. (B,C) Close-up view of the C-terminal region of GFPuv form I (B), form II (C). The C-terminal α-helices are shown in stick models, and the simulated annealing-omit electron density maps at 1.9 σ are shown in dark blue. (D) Close-up view of the region surrounding the chromophore. The chromophores and the side chains of the amino acid residues around the chromophore within 4 Å are shown in the ball and stick model. Colors for GFPuv form I and form II are same to those in A. The chromophore of GFPuv form I and form II are colored in orange and gray, respectively. All structure images were prepared using PyMOL (http://www.pymol.org).

