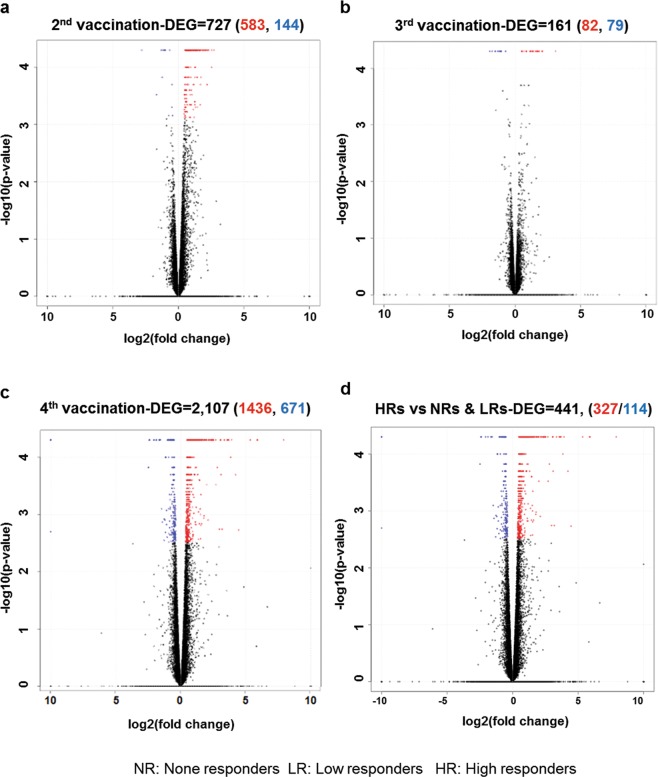
Figure 1.
Gene signatures of immunogenicity to Hantavax vaccination based on vaccine responsiveness. Transcriptomic data of the 2nd (a), 3rd (b), and 4th (c) vaccinations relative to pre-vaccination. Numbers of more than two-fold up- or downregulated differentially expressed genes (DEGs) identified from the comparison of the control and virus-infected groups (DEGs were identified based on a false discovery rate (FDR) q-value threshold of less than 0.05). The volcano plot shows the DEG patterns for Hantavax vaccinees. (d) Vaccinees were classified into three groups based on vaccine responsiveness (i.e. HTNV neutralizing antibody titers): NRs (non-responders), LRs (low responders), and HRs (high responders). The volcano plot shows the DEGs identified based on a false discovery rate (FDR) q-value threshold of less than 0.05 for Hantavax vaccinees between HR vs NR & LR. The x-axis represents the log2 values of the FC observed for each mRNA transcript, while the y-axis represents the –log10 values of the p-values of the significance tests between replicates for each transcript. Data for genes that were not classified as defferentially expressed are plotted in black.

