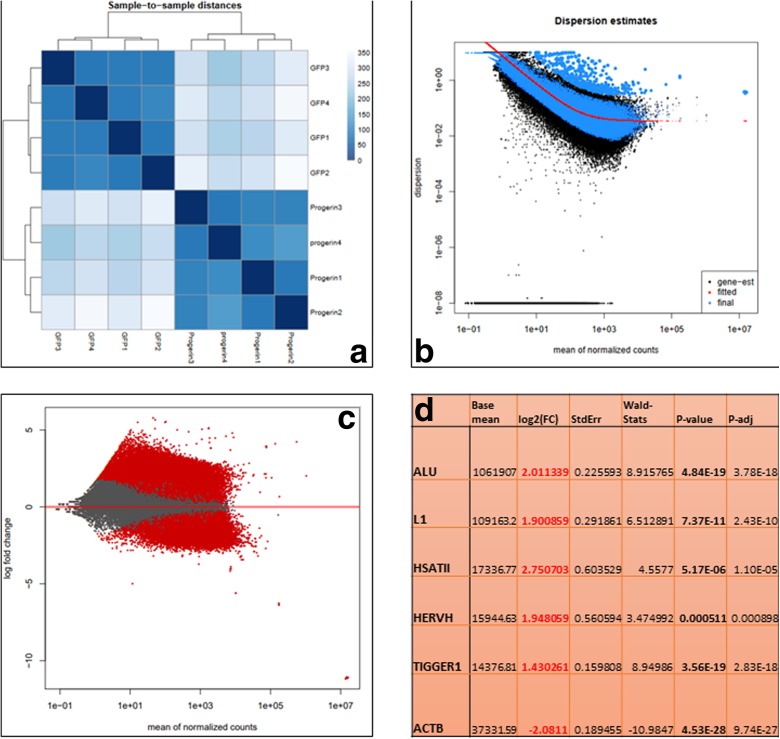
Fig. 2.
The results of the DESeq2 analysis. a Heatmap of the sample to sample distance showing that the two different conditions cluster independently. b The estimation of the dispersion of the reads. c MA plot of the distribution of the mean of the normalized counts. d The comparison of expression of selected sequences

