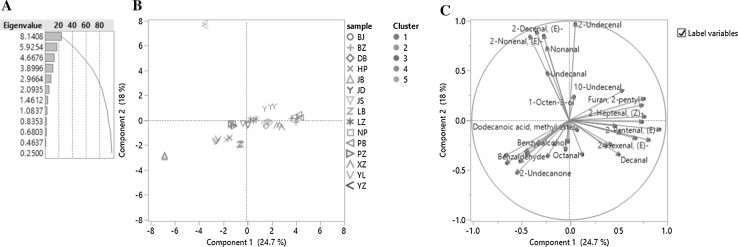
Fig. 1.
Principal component analysis of 15 cultivars of Jujube [a eigenvalues of principal components, b score plot of first two principal components (the same color in the score plot means they were in the same cluster, which were cataloged by HCA), c loading plot of different variances], legend of cultivars in b: different marks represented different cultivars, the colors of the mark were meaningless; legend of cluster in b: different color means different cluster (color figure online)

