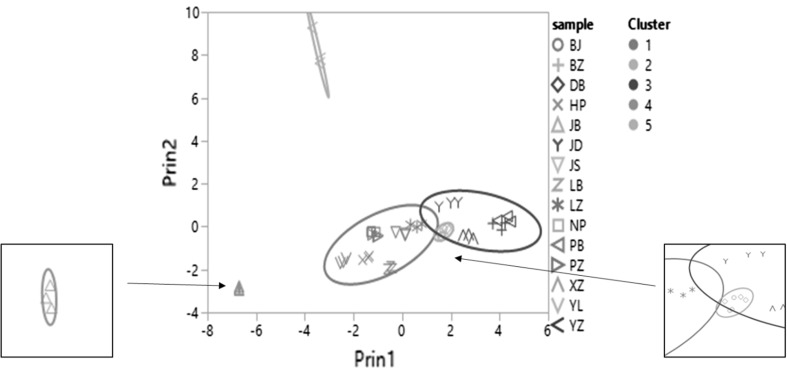
Fig. 3.
Bivariate fit of principal component 2 by principal component 1, legend of cultivars: different marks represented different cultivars, the colors of the mark were meaningless; legend of cluster: different color means different cluster. Density ellipses were shown in cluster grouping, p = 0.95 (color figure online)

