
Fig. 2.
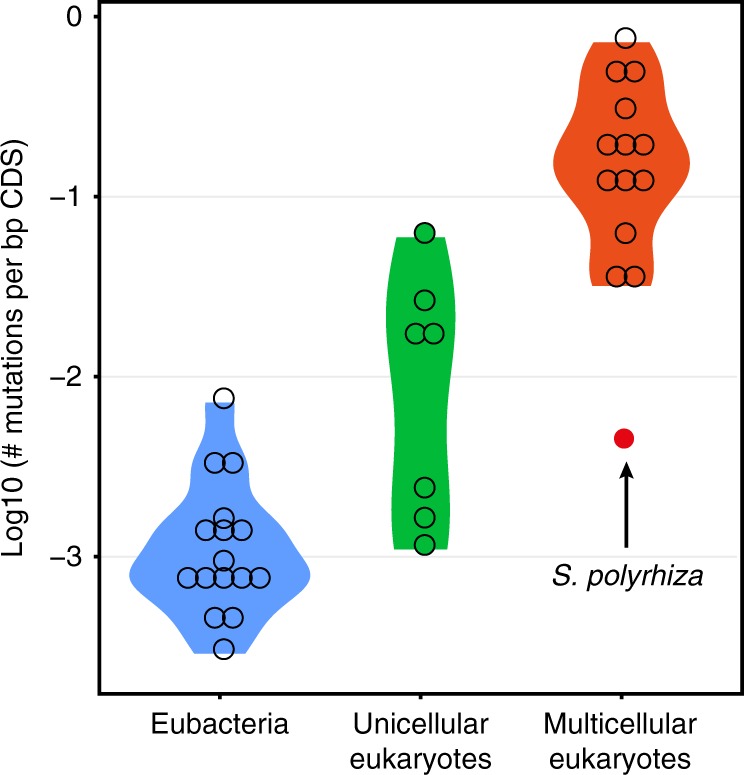
Estimated mutation rates in protein-coding regions among different organisms. The violin plots of log10-transformed numbers of mutations per base pair of protein-coding genome sequences (CDS) per generation for eubacteria, unicellular eukaryotes and multicellular eukaryotes, respectively. The kernel probability density is shown. Each circle indicates the estimate for one species. The arrow highlights the mutation rate in S. polyrhiza. Except for the mutation rate in S. polyrhiza, the plotted data were extracted from previous studies (Supplementary Data 3)