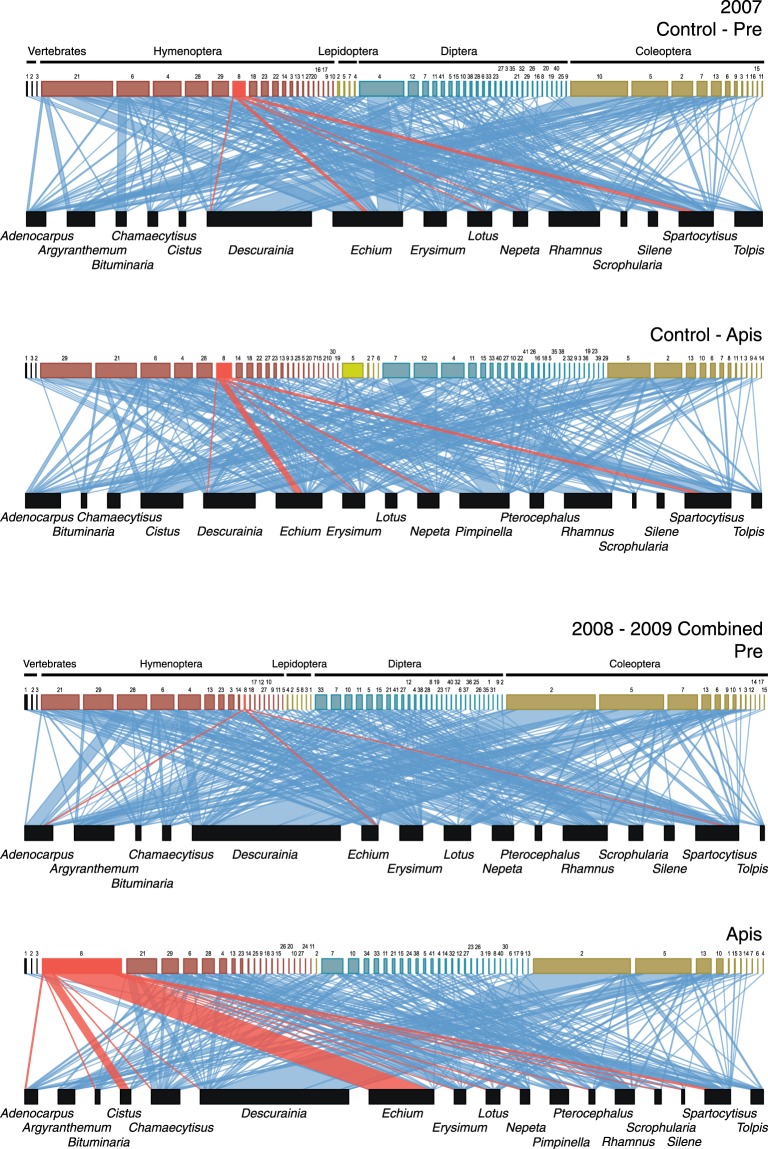
Figure 1.
Pollination networks in Teide National Park in 2007 (control-year, with no beekeeping activities) and 2008–2009 (experimental years) combined. Size of boxes is proportional to the total number of visits recorded per species. Link width represents the frequency of observed plant-pollinator interactions. A. mellifera and its interactions are in red. See species identities and results separately per each year in Supplementary Information.

